Social marketing is growing up: Not only have activity levels across social communities risen, but the number of brands now applying more focused and disciplined approaches to their social media communities has increased significantly over the past year, according to a study by ComBlu.
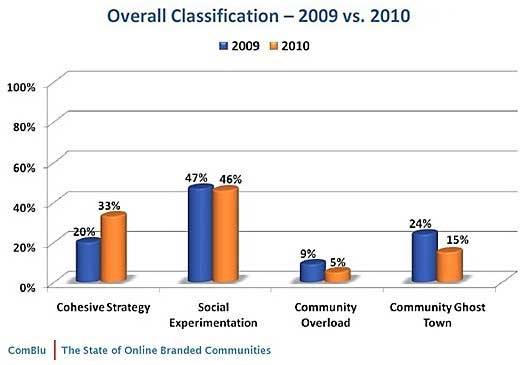
Among four defined stages of social media participation, nearly one-third of brands (25 out of the 78 studied) have a cohesive strategy for social engagement, compared with 20% who did so a year earlier. Such brands have a solid social media approach, with multiple activities rolling into a single online experience, according to the study.
Among the brands studied in 2010:
- Social Experimentation is most prevalent: 46% of brands are experimenting with social communities, lacking a long-term engagement approach, using instead a series of one-off experimental marketing campaigns.
- Community Ghost Towns (unpopulated communities) now make up 15% of communities, down from 24% 2009.
- Community Overload (multiple communities fighting for attention from the same audience) afflicts 5% of online communities, down from 9% in 2009.
Below, other findings from the second annual "State of Online Branded Communities," which explores 241 social communities among 78 major corporations.
Brands Improving Integration of Social Assets
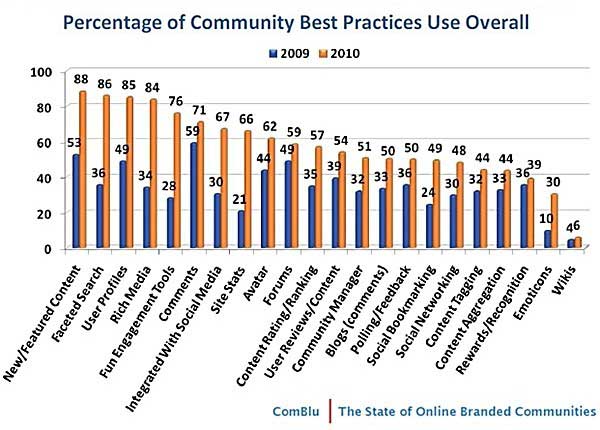
Branded communities are doing a better job integrating proprietary community sites with other social assets such as Facebook, Twitter, and YouTube. In fact, the use of strategically aligned engagement tools grew to 76% of online communities in 2010, up from 28% in 2009.
Key trends among the communities studied include:
- 51% of communities have visible active community managers who are the "face" of the brand and makes interactions more personal, up from 32% who did so a year earlier.
- 48% enable social networking between members, up from 30% in 2009.
- 85% allow for user profiles, up from 49% a year earlier.
- 86% use faceted search, up from 36% in 2009.
Untapped Opportunities
Many brands are still missing opportunities. For example, brand advocates are being ignored: Only 20% of communities have an advocate or expert group, that represents the "voice of the customer," contributes content, and helps recruitment.
Across other ComBlu-defined 2010 new best practices, brands' adoption levels are mixed:
- Share functionality: 61%
- Welcome messages to new members: 48%
- Campaigns and contests: 33%
- Content customization: 22%
Activity by Industry
Communities with the highest activity levels tend to focus on a specific need or interest, ComBlu finds. Despite creative engagement tools, those with no clear mission have less activity, overall.
Gaming (100%) and entertainment (89%) industries have the most active communities, followed by insurance (67%), technology (67%), and telecom (67%). With the exception of insurance, those industries are also the highest scoring overall (i.e., higher use of best practices).
Top Scoring Communities, by Industry
Based on adoption of such best practices, the highest scoring* industries are gaming (39%), telecom (39%), technology (35%), and entertainment (34%).
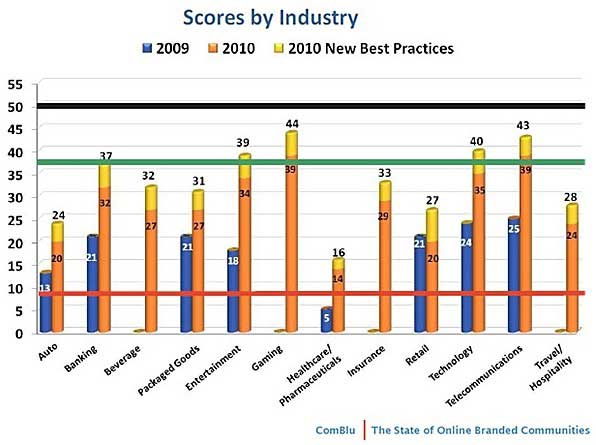
The most improved industries from 2009 to 2010 are entertainment, telecom, financial services, and technology.
Top-Scoring Brands
Across the 12 industries analyzed, the following companies are the highest performers:
- Auto: BMW Motorcycles (28), Toyota (26), and Ford (23)
- Banking/Financial Services: American Express (48), Bank of America (36), and JP Morgan Chase (33)
- Beverages: Starbucks (36), Pepsi (33), and Coca-Cola (21)
- Entertainment: Discovery (45), Bravo (42), and Comcast (41)
- Gaming: EA (47), Activision (44), and Xbox (42)
- Healthcare and Pharma: Johnson & Johnson (21), Bayer (20), and Novartis (16)
- Insurance: Humana (39), GEICO (38), and State Farm (28)
- Packaged Goods: Kimberly-Clark (44), Kraft (35), and Proctor & Gamble (35)
- Retail: Sears (44), Whole Foods (41), and Best Buy (32)
- Technology and CE: Hewlett-Packard (45), Dell (42), and Microsoft (40)
- Telecom: AT&T (44), Verizon (44), and Sprint (28)
- Travel and Hospitality: Marriott (30), Fairmont (26), Southwest (26), and Starwood (26)
A detailed analysis of the 75 brands studied is available.
*Scores between 0 and 34 are considered "low performers" and are in the red zone. Scores between 35 and 49 are high performers and place in the green zone. Scores of 50+ are considered "best practices leaders."
About the data: The audit of 241 online branded communities among 75 US companies was conducted by ComBlufrom July to August, 2010. Each site was analyzed against 22 community best practices. A separate scorecard was used for the 2010 study to track adoption of an additional ten best practices. None of the companies were aware that their sites were being analyzed, and ComBlu did not contact these companies prior to the analysis of the data it collected.
- Connection to offline engagement: 20%
In addition, only 40% of the communities offer rewards or recognition programs, considered key drivers for sustaining participation.